YT Analytics Dashboard Not for sale
A personal tool · by Shahrukh Sheikh
Python · Flask · SQLite · YouTube Data and Analytics APIs · Runs on your own PC
Why is this video underperforming? Ask the dashboard, not three browser tabs.
A local web app that pulls the real numbers for every channel I run, compares the channels side by side, and checks each video against a set of plain rules, so it can say "people leave in the first seconds" or "this one lost subscribers" instead of leaving the diagnosis to me. Nothing goes to any server but Google's.
Personal project · Not for sale · Read-only access to your channel · Data stays on your computer
At a glance
The dashboard in numbers
12
Diagnostic rules
Ten of them work on real channel data. Two need impressions, which YouTube keeps to itself.
365
Days per sync
Each pull looks back a year, for up to 200 videos per channel. Every pull is stored as a new snapshot.
2
Read-only permissions
One to read videos and one to read analytics. The app can't change, delete or publish anything.
0
Cloud services
No server, no sign-up, no subscription. A Flask app on your PC and a SQLite file.
Why it exists
YouTube Studio shows you numbers. It doesn't tell you what's wrong.
I run several channels: a tourism channel, a podcast and a tutorial channel. Each has its own Studio, and none of them says "this video's viewers leave early" or "this channel's last five videos are doing worse than the five before". You get charts and decide for yourself, three times, every week.
This app does that reading for me. It collects the numbers once, sets every channel next to the others, and ranks them by how many serious problems each one has. The question I open it with is simple: which channel needs my attention this week, and which video is the reason?
How it works
Six steps from "connect" to "what do I fix first".
Connect
Sign in with Google once per channel. The sign-in is read-only.
Pull
One button fetches the videos and a year of analytics for each.
Store
Each pull is saved as a new snapshot in a local SQLite file, never over the old one.
Diagnose
Rules read the numbers and flag what's wrong, with a severity.
Compare
Channels are ranked by high-severity issues, so the worst one is first.
Explore
Open a video for its retention curve, or a channel for trends and topic ideas.
The screens
Real screens, running on sample data.
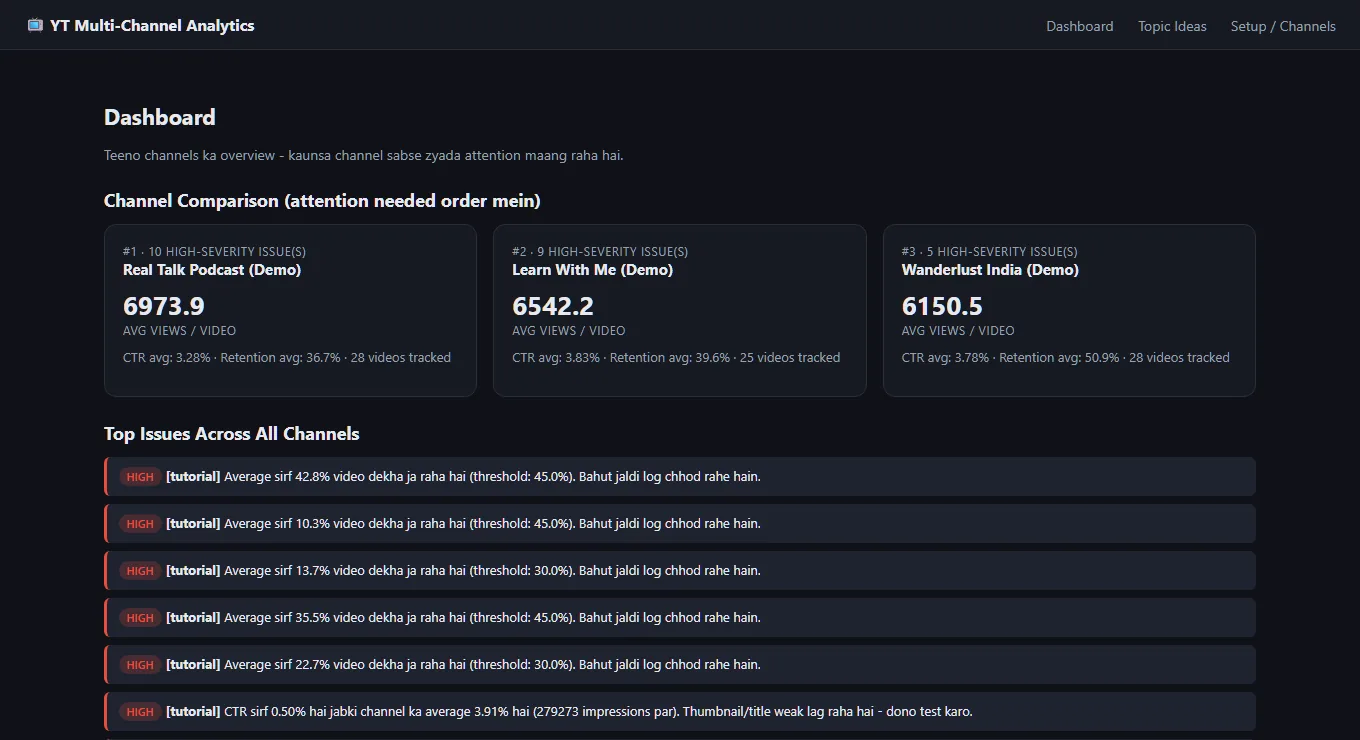
These are screenshots of the real app running its built-in demo data, three made-up channels, so none of my actual numbers are shown. The demo data includes click-through rates and impressions, which a real YouTube channel cannot give the app (see what it doesn't do).
Channel page
Every video, with what's wrong next to it.
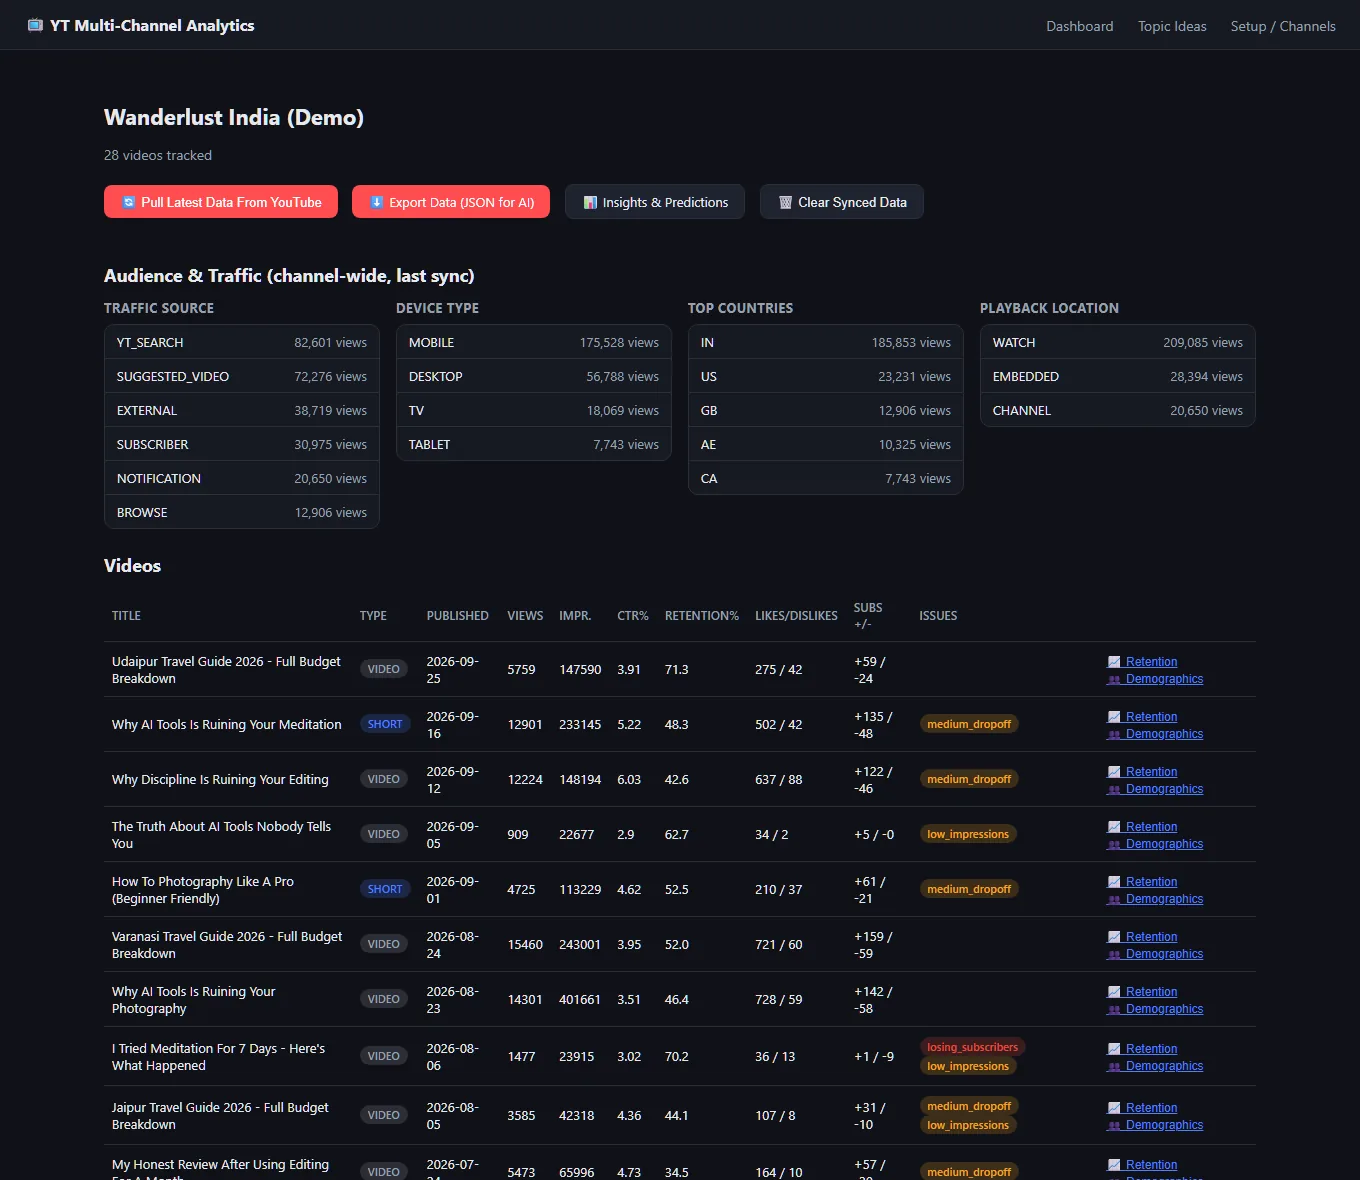
- Where the views come from: traffic sources, device types, top countries and playback locations for the whole channel.
- One row per video: type (video or Short), date, views, retention, likes and dislikes, subscribers gained and lost.
- Issue tags on each row, coloured by severity.
- Retention and Demographics links open a video's own charts, fetched when you ask.
- Buttons to pull the latest data, export to JSON, open Insights or clear the synced data.
Insights
Direction and patterns, with no black box.
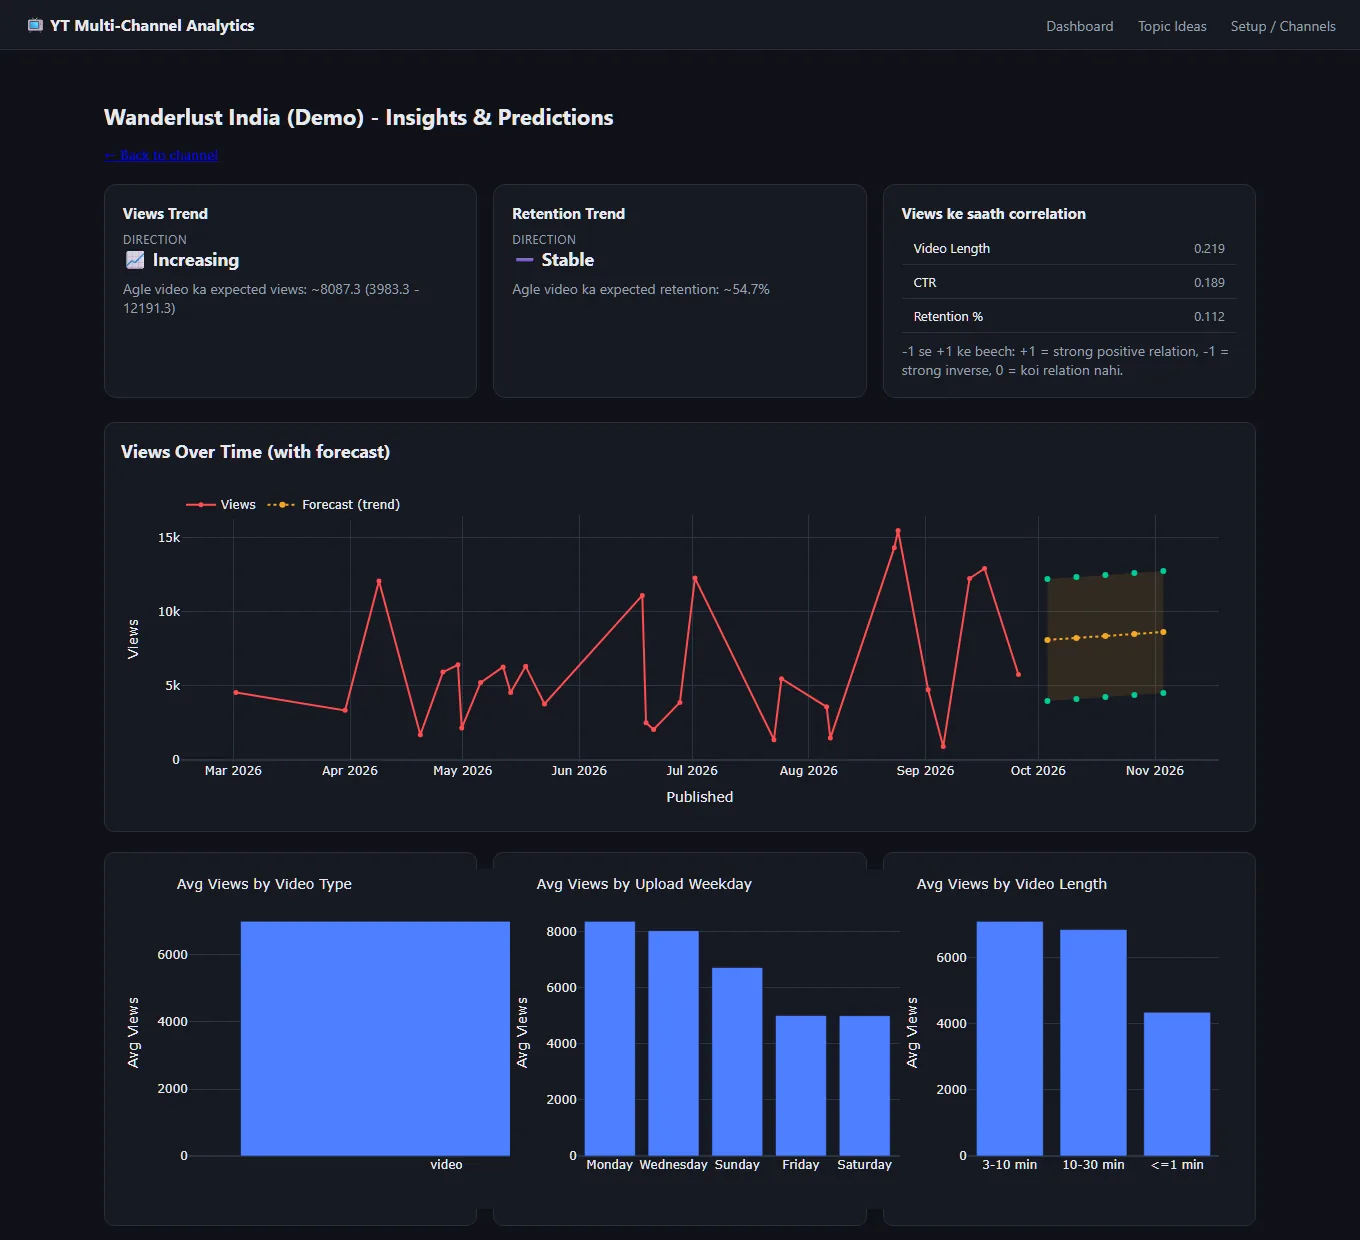
- Views trend and retention trend: increasing, stable or decreasing, from a straight line fitted through your videos.
- Forecast: where the next five videos' views are likely to land, drawn as a range.
- Patterns: average views by video type, by weekday you uploaded, and by length bracket.
- Correlations: how strongly length, CTR and retention move with views, from -1 to +1.
Every number comes from plain averages and a linear trend, on purpose. A fancy model I can't explain is not something I'd make a decision from.
Topic ideas
What to make next, with the evidence.
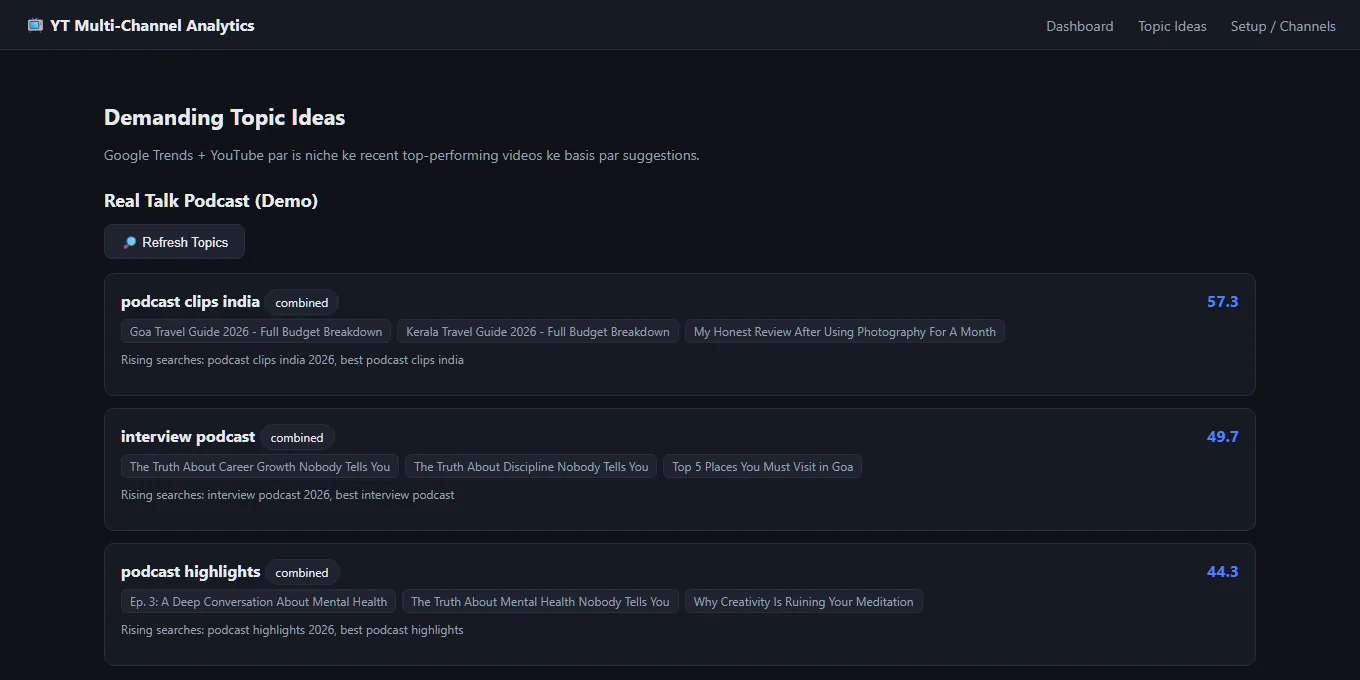
- Google Trends: recent search interest and rising searches for each channel's niche keywords, for India.
- Competitor videos: the most-watched videos in the same niche over roughly the last 45 days.
- One score per topic, with example titles under it so you can see why it ranked.
- Niche keywords are detected from the channel itself, and you can override them.
The diagnostics
Twelve rules, and what makes each one fire.
Every flag comes from a rule you can read, with the thresholds in one config file you can change. Shorts get stricter retention limits than normal videos, because a good Short is watched almost to the end. Live streams are left out.
| Rule | When it fires |
|---|---|
| High High drop-off | Average view percentage is under 30% for a normal video, or under 45% for a Short. |
| Medium Medium drop-off | Average view percentage is under 45% for a normal video, or under 65% for a Short. |
| High Confirmed early drop-off | The retention curve (fetched when you open a video's Retention view) shows the watch ratio falling by more than half in the first 10% of the video. |
| Medium Low completion | People watch less than 25% of the video's length on average, and there is no retention curve to say where they left. |
| High Losing subscribers | More people unsubscribed after watching than subscribed. High when the losses are more than double the gains, medium otherwise. |
| Medium Low Short engagement | A Short with at least 200 views where likes, comments and shares are under 1% of views. |
| Medium Few engaged views | A Short where fewer than half of its views count as YouTube's "engaged views". |
| Medium Inconsistent uploads | One of the last five gaps between uploads was longer than 21 days. |
| High No recent upload | The newest video is more than 21 days old. |
| High Declining momentum | The last five videos average over 30% fewer views than the five before them (high when the fall is over 50%). |
| Medium Low click-through rate | Needs impressions, which the API doesn't give. Would fire when CTR is under 60% of the channel average. |
| Medium Low impressions | Also needs impressions. Would fire when a recent video's impressions are under 40% of the channel's median. |
The last two rows can't fire on a real channel. They need impressions and click-through rate, and YouTube doesn't expose those to apps. They're in the code for the day it does, and the demo data includes them so you can see what they'd look like.
There is also a longer-form "funnel" check that tries to name the bottleneck for a video (low reach, weak thumbnail, weak retention or healthy). When the inputs it needs are missing, it says insufficient data instead of guessing, which is what it says for every real long-form video today.
Every feature
Everything the dashboard does.
Dashboard
- Channels side by side with average views, average retention and how many videos are tracked.
- Ranked by need: the channel with the most high-severity issues comes first.
- Top issues across all channels in one list.
Data collection
- Videos: up to 200 per channel, with type, length and publish date.
- Per-video numbers: views, likes, comments, shares, minutes watched, average view duration and percentage, subscribers gained and lost, engaged views.
- Channel-wide: traffic sources, devices, operating systems, countries, playback locations, sharing services, demographics, subscriber status and playlists.
- On request, per video: the retention curve, traffic sources, demographics and subscriber status.
- One report failing doesn't stop the rest. Each group of metrics is requested separately and the app records which ones YouTube couldn't supply.
Diagnostics
- Twelve rules with severity and a plain-language reason, in the table above.
- Separate limits for Shorts and normal videos.
- Re-run after every pull, so the flags always match the newest numbers.
Insights
- Trend direction for views and retention.
- A five-video forecast range from a linear fit.
- Averages by video type, upload weekday and length.
- Correlations with views for length, CTR and retention.
- Interactive charts you can hover and zoom.
Topic research
- Google Trends interest and rising queries through the pytrends library.
- Competitor search on YouTube for the same niche, last ~45 days.
- If Trends is rate-limited, the competitor suggestions still work.
Control and privacy
- Add or remove a channel from the Setup page, with no file editing.
- Export a channel to JSON, with the diagnostics included, to read or to paste into an AI tool.
- Clear synced data for a channel in one click.
- Demo mode: load sample data to try everything without connecting an account.
- History kept: snapshots build up so you can see change over time.
What you need
To run it, if you build one.
| Runs on | Any computer with Python 3.9 or newer. Built and used on Windows. |
| Python packages | Flask, the Google API and auth libraries, pytrends, pandas, plotly and numpy. |
| Google setup | A free Google Cloud project with the YouTube Data API v3 and YouTube Analytics API switched on, and an OAuth "Desktop app" client. One-time. |
| Where it's open | In your browser at 127.0.0.1 port 5000, on the same computer only. |
| Where data lives | One SQLite file on that computer. |
| Internet | To pull data, for Trends, and to load the chart libraries from a CDN. |
Being honest
What it doesn't do.
- No CTR or impressions on real channels. YouTube doesn't expose them through the public API, so two rules never fire and the funnel check says "insufficient data" for every real long-form video.
- Not a product. It's a personal tool: not published, not for sale and with no installer.
- One user, no login. It's a local Flask server meant for one person, and anyone who can open the browser on that PC can see it.
- Sign-ins lapse about weekly while the Google project is in testing mode.
- Charts need internet. The chart libraries load from a CDN, so offline the tables work and the charts stay blank.
- Shorts are a guess, from length alone (183 seconds or less).
- The forecast is a straight line, not a model.
- Google Trends can be rate-limited, because pytrends is an unofficial library.
- The interface is in Hinglish, and has no automated tests.
FAQ
Questions people ask first.
Can I download it or buy it?
No. It is a personal tool: not for sale and not published. These pages show what it does and how it was built. If you want something like it for your own channels, get in touch.
Does it show click-through rate and impressions?
Not for real channels. YouTube does not hand impressions or click-through rate to apps through its public Analytics API: I tested every query shape, and the answer is always "not supported". Those columns stay empty and the two rules that need them never fire. The built-in demo data does include them, which is why the screenshots on this page show CTR.
Where does my channel data go?
Nowhere else. It goes straight from Google to your computer and is stored in a SQLite file there. There is no server behind the app, and no third-party analytics service ever sees it. The sign-in is read-only: the app can see your numbers, and it cannot change anything on your channel.
Can it see my revenue?
The code to fetch revenue is there, but the extra permission it needs is switched off in the config, so by default the app asks only for read-only video and analytics access. Turning it on means signing in again on every channel.
Why do I have to keep signing in again?
This is Google's rule for apps that are still in "Testing" mode on the consent screen, which is how a personal tool like this runs: the sign-in lapses after about a week and you authorize the channel again.
Is the forecast reliable?
It is a straight line fitted through your videos in order, extended five videos ahead, with a range around it. There is no seasonality and no machine learning: it tells you the direction, not the future. It needs at least four videos.
What counts as a Short?
YouTube doesn't flag Shorts in its data, so the app treats a video of 183 seconds or less as a Short. It is a rule of thumb, and a short ordinary video can be counted as one.
Why is the app in Hinglish?
It was built for my own use, so the messages and explanations are in Hinglish, mixed with plain English labels. The screenshots show it exactly as it is.
Want the build story: why the funnel check says "insufficient data", how a failing report can't break the sync, and how I confirmed that CTR isn't available?
Read the case study